Background of lab 3 assignment:
Climate change weather events happen frequency all around the world, where it causes a lot of damage to humans and countries. In Metro Vancouver, flooding is a potential climate event that may happen in the future. In order to reduce the damage of flooding during a storm surge in Metro Vancouver, I had created 4 maps showing which areas of Metro Vancouver affect flooding the most.
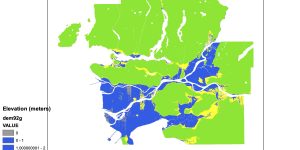
First map:

The first map provides elevation data in Metro Vancouver. The colour blue represents the lowest elevation and green represents the highest elevation in Metro Vancouver.
Second map:

The second map used two data (elevation and flooding within 5m). By using the data, readers know which area of elevation is lower or equal to 5m. Which gives a signal to readers which areas will have flooding happen during a storm surge.
Third map:

The third map is similar to map 2, but I added road data of the graph to show what will happen during a storm surge.
Fourth map:

I looked at a specific area of Metro Vancouver where schools and hospital located. From the map, lucky there are zero schools and hospital will have flooding happen during a storm surge, but if flooding is above 5m, then there will have a few schools affect at that time.
Reflection:
After finish analyzing the storm surge scenario, I realize that area such as Richmond and Delta elevation are below 5 meters which represent on second map (Potential Flooding in Metro Vancouver in elevation within 5 meters). These areas in the future have the potential danger if storm surges happen. Since based on Wikipedia, the highest record height of storm surge is 8.5m. However, while I am analyzing Metro Vancouver using DEM resolution, I find out a few data errors. For the dem92g data file, it focuses on the whole area of Metro Vancouver with a resolution 25m. And for the fcdem1m data file, it focuses on a specific area of Vancouver with 1m. When comparing two data files on that specific area, I find out that on the fecdem1m data file some areas of elevation have changed, which is different on the dem92g data file. The differences lead to the accuracy of analysis potential areas of flooding because some areas have different elevation which may give false information to a citizen. I think the resolution different lead to data elevation because 25m resolution has to a high chance that data is inaccurate. Therefore if the resolution is similar to the fecdem1m data file, I think the data will become more reliable for citizens or governments to prevent storm surge.
Maps relation to me
From the lab assignment, the storm surge is related to me a lot, since I am living in Vancouver, where the flooding affects me the most. By creating maps, I am able to know which area I need to pay attention more in Vancouver when flooding happens.
Things I learned in this assignment:
1. Spatial Analysis
2. Map layout(all maps I created have a lot of mistakes, but hopefully I can create a better one next time.)
3. Editing on GIS
Learning Significance